 | ||
|
> Research | > Value Judgements |
| ||
|
> Research | > Value Judgements |
A "value judgement" is a situation where one value must be chosen from an infinite number of alternatives. This occurs when there are no discrete choices, but rather a numeric value to be decided. Examples are choosing speed limits, taxation levels, or expenditures for various public works. These are sometimes also called "analog" choices, because there is a continuous "number line" to represent the possibilities.
This contrasts from a discrete choice, as demonstrated in the rules of the road simulation. In that example, vehicle drivers had to choose between passing on the left or the right when encountering an oncoming car. Every person wanted the same thing: to travel quickly and safely. So they merely needed to arrive a a rule that would achieve that. It turns out that there are "two right answers" because either rule would work, so long as everyone follows it. In a trial-and-error process, people will eventually arrive at one solution or the other.
A value judgement, by contrast, is more complex. That's because not only are there an infiniate number of options, but there is often lack of precision in determining a best choice. There can be a range of uncertainty, resulting in multiple desirable choices in the vicinity of the best choice. Nevertheless, a specific choice must be made. If a variety of people are consulted to select the best choice, each might select a different value.
For example, consider setting a speed limit for a highway. There are infinite choices because it is an "analog" scale rather than a "digital" choice among specific items. The speeds to choose from are not just 30, 50, 70, 100, or 110 km/hour that are often seen on roads. Other possibilities are 101, 102, 103, 104... And if that's not enough to choose from, how about considering 101.1, 101.2, 101.3...
This can be a tricky problem, because we wish for all those who travel on the road to be happy. If each person has a different preference among an infinite number of choices, how can we arrive at a mutually satisfactory solution?
There are several strategies that can be employed in such cases. We'll present each of the strategies and illustrate them using the "speed limit" example. As you will see, it is possible to use multiple strategies together. Here is the prescription...
This step simply rounds off the available choices. For a highway speed limit, differences of less than 5 km/hr may be negligible to the safety of the travel, in which case we only have to choose among a series of 0, 5, 10, 15, 20, etc. We might also recognize a practical upper limit of how fast a vehicle can travel. Now we no longer have an infinite number of items to choose among.
For this example, we'll assume that people who travel on any given road want to have a speed limit that applies to all of them. Although drivers could simply make their own decisions about speed, if they drive at a dangerous speed they put their passengers at risk and also risk crashing into other vehicles or pedestrians. So they want a limit that protects all of them.
In order to decide this, it is necessary to know how fast it is safe to go. Let's consider an example of a new country road that hasn't yet been assigned a speed limit. To assess what is safe, we could identify other similar roads, find out what speed limits were set on those, and then check what is the accident rate on those roads.
That data isn't easy to get, and moreover the data will be different for different kinds of roads (such as wide prairie roads vs curvy narrow mountain roads, etc.), so for illustrative purposes I will use fictitious data applying to a fictitious road:
Demo Data
| Speed | Risk of Harm over lifetime |
|---|---|
| 0 | 0% |
| 10 | 1% |
| 20 | 1% |
| 30 | 2% |
| 40 | 2% |
| 50 | 3% |
| 60 | 4% |
| 70 | 6% |
| 80 | 8% |
| 90 | 10% |
| 100 | 12% |
| 110 | 15% |
| 120 | 18% |
| 130 | 28% |
| 140 | 45% |
| 150 | 80% |
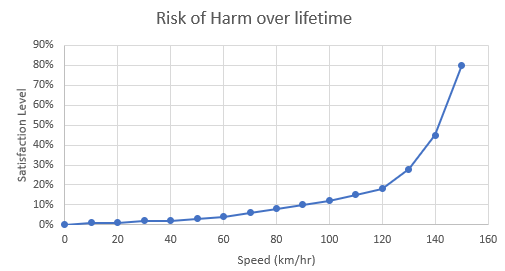
In this example, the "risk of harm over lifetime" is the odds of having any significantly harmful result such as wrecking the vehicle, bruises and broken bones, or death. The odds of harm are not from just one trip over the road, but from driving over it regularly over one's whole life. Ongoing risks related to wind, rain, inattentiveness, etc., are made worse if one is going faster, so this is the hypothetical chance of something very bad happening to any given driver eventually.
On the graph you can see that the risk remains fairly flat up to about 80 km/hr and starts to rise gradually at first, with a dramatic rise starting at about 120 km/hr.
For data at the higher end, we might lack any comparable roads with those speed limits. However, there are other means that could be used to estimate the risk. For example, we could use a wide track such as race-car drivers use, with run-off areas around the curves. We could paint lines on the track that are the same width as the country road, with the same amount of curvature. A driver could drive on this track at high speeds, and if he goes over the edge of one of the lines, that would count as a "crash." (Even though he wouldn't be harmed on the race track, going over the edge on the country road would roll him into a ditch.)
Also, this analysis would have to be adjusted for the fact that typical cars on a country road are not as well protected or maneuverable as a race car. The top end of our graph would be an estimate, and probably it doesn't need to be extended very high up, as the road would simply become undrivable and incredibly risky at some high speed.
So, let's suppose an analyst has prepared the above data. He recommends a speed limit somewhere in the green range marked on the chart, between 80 and 120. Above that, the risk is so great that he believes nobody would accept it. Below 80, it's very safe, but it's too slow: the people who live in the rural area have long distances to travel in order to transport their grain and other materials, and they can't spend their whole life wandering along the roads like turtles.
We still don't have a specific speed limit, but only a range of possibilities. However, if we trust that the analyst has about the same risk tolerance as most other people, we could simply ask him for a recommendation. He might pick a mid point of 100 km/hr, and then we're done. However, if we're not comfortable with that assumption, we have a bit more work to do...
It is a fact of nature that different people will have different risk tolerances. You can see it in investing, where some people will choose more risky investments than others. Sometimes higher risk can have potentially higher rewards and pay off more in the long run, and if a person has surplus cash they can afford to take such risks. Other people simply can't afford to take the risk, such as a pensioner who relies on the investment for his survival.
Likewise, we'll see this among the drivers of our country road. The farmers who live along it need to get work done and goods transported, and they may wish to risk higher speeds than city folk who use the road for a leisurely Sunday drive to see the scenery.
So, let's do a survey of a few people. Ideally, we would need at least 30 for any hope of a representative sample, but to keep this example simple I'll show hypothetical responses from 9 people. We ask them how satisfied they are with each potential speed limit, where 100% is completely happy with that choice and -100% is completely unhappy.
So, each person looks at the data and picks their preferred speed limit. All of them have chosen speed limits that are within the 80 to 120 km/hr range that the analyst considered to be safe:
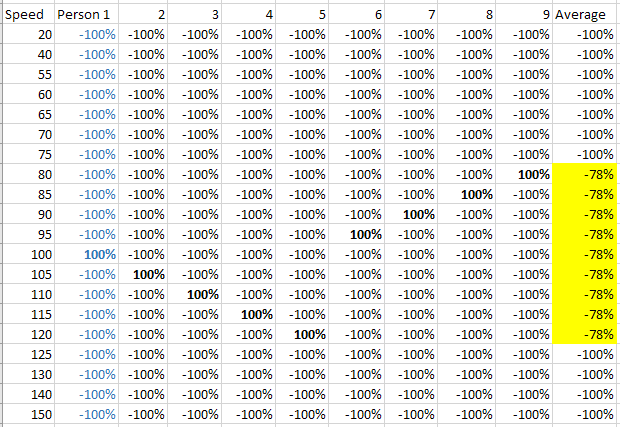
Demo - Respondents with very narrow preferences
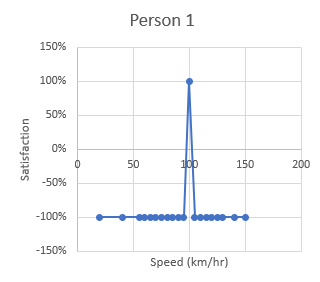
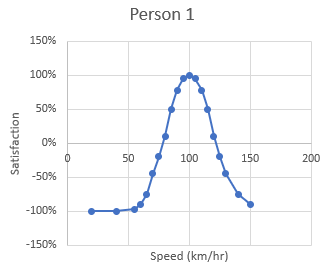
Graph for 1st person's value judgement
This example is a bit contrived, because each person chooses a different speed limit, and moreover, each is totally dissatisfied with any speed limit other than the one he has chosen. If we average the results in order to see which is "most satisfying overall" we discover that it's impossible to get a positive overall score for any speed! This is a disaster!
However, it is also unrealistic.
Most people will not believe that their preferred choice is so exact that no other speed will do. Rather, each person will have a range of acceptable speeds, and within that range they will be more or less satisfied. So, we'll take care to ask our participants to rate their satisfaction level with the different options, to the nearest 10% or so, not just at +100% or -100%. In that case, well get more useful data:
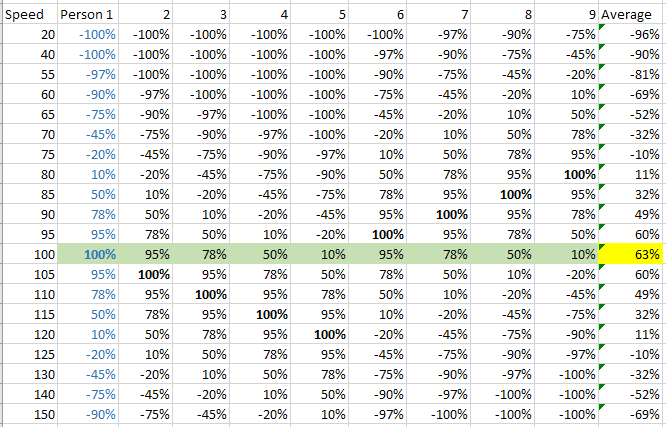
Demo - Respondents with normal preferences
Graph for 1st person's value judgement
As you can see, each person still has a different favorite choice, shown by the 100%s shown in bold text in each column. However, the individuals are partially satisfied with speeds that are near their choice. The average satisfaction is now positive for a variety of speeds on this road, and highest for the 100 km/hr choice. You can see this too in the graph below, which roughly approximates the "bell curve" that is seen so often in statistical results.
Why does the average matter? Well, imagine that you are one of these drivers, who will be travelling regularly on this country road after the speed limit is set. Which of these methods would you prefer for setting the speed limit:
Method "a" is the democratic solution, except that democracy gives a wider survey covering all the electorate.
Method "b" is the method you get in a dictatorship. The dictator chooses what he wants according to his personal values, which could be anything, because he is not held responsible to the general public.
You can do a little experiment to test this out. Pick one of the speeds in the green range that you would like. You can pick the column that matches your opinion, or you can create your own column that has your satisfaction levels for each possible speed.
Now let's have the dictator choose a speed. He could pick anything, so pick one of the speeds at random. (For example, you could roll multiple dice to pick among the choices). See how satisfied you are and note it down. Do this multiple times. Average your results across the whole experiment.
Now compare how this worked out for you, as compared to simply picking the 100 km/hr speed that was chosen by the democratic method.
You will likely find that you are usually more satisfied with the democratic choice than the randomly selected arbitrary choice.
The random choice has a potential advantage to you: it could be closer to your wish than the democratic choice. However, it also has a potential disadvantage: it could be further from your wish than the democratic choice.
If it's fairly close to your preferred choice, that nice, and there are a bunch of nearby values that would be OK for you. But if it's far from your preferred choice, that's not just bad, that's horrible!
The reason for that situation is that levels of satisfaction are not linear. The joy you get from being close to what you want is not adequate compensation for the risk of being very far from what you want. So, the two risks don't balance each other off.
To demonstrate, let's consider person #3 from the above chart. We will select some random speeds, to see how he likes them. Here is one set of random speeds produced using Excel (RAND function):
Random tests - speeds in range 80 to 120
| Person | Preferred Speed | Random Speed Limit | Satisif. Level |
|---|---|---|---|
| 3 | 110 | 115 | 95% |
| 3 | 110 | 100 | 78% |
| 3 | 110 | 95 | 50% |
| 3 | 110 | 110 | 100% |
| 3 | 110 | 100 | 78% |
| 3 | 110 | 120 | 78% |
| 3 | 110 | 90 | 10% |
| 3 | 110 | 115 | 95% |
| 3 | 110 | 90 | 10% |
| 3 | 110 | 90 | 10% |
| 3 | 110 | 95 | 50% |
| 3 | 110 | 110 | 100% |
| Average | 63% | ||
| Person | Preferred Speed | Democratic Speed Limit | Satisif. Level |
|---|---|---|---|
| 3 | 110 | 100 | 78% |
Using these random numbers that the dictator might choose, if you average the results then person #3 would expect to be about 63% satisfied, as his best guess at the outset.
However, if the speed limit of 100 km/hr is used, as preferred by most of the respondents, his satisfaction level will be 78%. It works out well for him because his own desires are fairly close to that of the average person.
This test can be repeated for person #3 with different random numbers, but the results tend to be about the same. The odds are that the random speed will not be as favorable as the average selected by the group.
However, for people who have values very different from the rest of the population, the advantage of using the population's preference (as compared to a random choice) disappears. Consider person #5, who only gets 10% satisfaction from the democratic choice of 100 km/hr. For him, a random choice would produce satisfaction somewhere between -90% and +100%. He hasn't got much to lose from having a random choice.
Suppose a person's values were more extreme yet. It's not shown on the chart, but if a person preferred 130 km/hr and had the same shape of preference curve, the democratic choice of 100 km/hr would give him -100% satisfaction. One can't get worse than that. If we expand the random choice range to include 130 km, there would be at least a few of the random choices that would be acceptable to him.
Notice also that 130 km/hr is outside the "safe" range; it's on the part of the risk curve that rises rapidly. In order for a people to make rational choices, they need to be well informed! We can assume that the guy that wants to go 130 km/hr on this country road is either a real risk taker, or simply uniformed of the risk.
Also, we should keep in mind that our chart showed exactly one person with a 100% preference for each speed within the 80 to 120 km/hr range. In real life, most people's preferences tend to be clustered around the average. So there would be most people who prefer 100 km/hr in this case, slightly less who prefer the speeds 5 km/hr out from that (95 or 105), less yet who prefer speeds 10 km/hr out, etc.
So long as individuals are each willing to accept a range of speeds, it is generally possible to please most of them.
If a person has a particular preference but he doesn't know yet what the average preference will be, it is generally a wiser choice to accept the average that the group will decide, as compared to having an arbitary choice to be randomly selected by a dictator. Doing so puts the odds in his favor.
There could be one exception to that: if the person knows in advance that his preference is similar to the dictator, he might prefer the dictator's choice. The dictator's choice could be very displeasing to most other people if it is much different from the average. Maybe the dictator doesn't care, but even dictators may find it wise to pay attention to what most of their citizens want.
There is one more point to be made here. So far, each person has indicated their "preference range." However, typically a person has a "compliance range" that is wider, where they will follow the rule even though they dislike it. That's because there are many rules in society that they like, and to get the benefit of those rules sometimes it is necessary to make some compromises that please other people. In general, the "rules of the road" in any given society is a package, including such things as stopping at red lights, driving on a given side of the road, etc. If individuals "opt out" whenever they please, the situation can degenerate into random interactions that are worse for everyone.
This is a basic principle of any kind of ethics implemented in a society. People give up the rights to do things that are harmful to others as part of a mutual agreement that protects each of them. Generally individuals will give up things that aren't important to them in order to gain a greater benefit.
In the case of the speed limit, it was necessary to make a joint decision. If each driver simply took his vehicle at any speed he (or she) thinks is safe, without being informed of the risks, and without understanding how much risk others are willing to take:
However, not all decisions are like that. Sometimes a decision affects only the person who makes the decision, or a small group that can make it for themselves without affecting others.
As an example, consider buying food at a grocery store. Each person or family buys according to their needs and tastes. One person who loves a particular food--say, hot-dogs--may buy a bunch of them, while another person might buy only one, or none at all. If everybody was simply supplied food by the government in fixed rations, that would give rise to a lot of problems. Some would have food they didn't want, which is wasted. Others would be short of particular foods that they do want.
Regarding the prices in the stores, those actually are set as a kind of average. In a free market, the prices are determined by the forces of "supply and demand." Those producing a product may wish to sell it at very high prices, but they are limited to the lowest price that other producers will sell it for. Otherwise nobody will buy it. And that price also has a lower limit, because the producers have to pay a wage to their workers, and workers will not accept a low wage when other producers offer a higher one.
It is important to distinguish between choices that people need to make jointly and those they do not. Each person has their own personality and their own circumstances. They don't all want exactly the same things in the same amounts at the same times. People need liberty to accommodate variations among them. This is necessary for the happiness of each person, as well as for happiness overall.
Even in the speed limit example, flexibility is important. It's not just that individuals need to be flexible to accept a range of speed limits. They can also benefit from some creativity...
For the speed example, we have assumed some constraints. We were given a road of a specific type, and asked to set a speed limit for it. Perhaps it was a 2-lane paved country road across a prairie and a wooded area, with a few gentle turns, and some obstructions that prevented seeing far around the turns. Also, there are some side-roads that intersect it, where cars might be slow at they pull onto the road. So, it had its own hazards, that necessitate limiting speed. Or is this truly a constraint?
Couldn't the road be widened, with a shoulder added, to reduce the risk of going off the edge of the road into a ditch? If a 1 second distraction took a person off the road at 100 km/hr, adding a wide shoulder to the side of the road might give him 2 seconds before hitting the edge. Also, a rumble strip could be put on the inside edge of the shoulder as an alert.
As for the side roads, they could be rerouted and in some cases bridges or interchanges could be built. The road could be designed to accommodate a higher speed safely.
Now we're into a different kind of value judgement. Is it worth the expense to improve the road? Is the general population willing to pay higher taxes in these kinds of situations, so that they can travel faster, or would they prefer to keep their money and leave the roads as-is?
Looking at the charts and graphs we've seen, one might suppose it's possible to calculate the best solution. Well, perhaps it is possible, if the calculator could also come up with every possible alternative. Thus far in our history, it's the people that have the creativity, and often it occurs subconsciously in their brains, so they can't explain how it happens. Therefore, we'll leave it for now that calculation is a tool to supplement creativity and intelligence, rather than a complete solution by itself.
This is one other advantage of a democratic solution, that everyone is invited to offer their own package of what they would propose to do jointly, and what is to be left as individual choice. With the many thousands of people in a town or province or nation, that's a lot of creativity to draw on.
What do you think of the content on this web page?
| Site Search | |
Return to Universal Ethics home page |